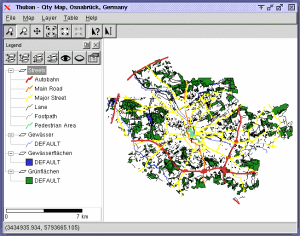
Thuban Main Window
 The Thuban Main Window falls into
five major parts:
- Map
- Legend
- Statusbar
- Toolbar and
- Menubar
|
| |
Layer Properties
 Aside the layer title the properties dialog mainly focusses on the legend: The layers objects can be grouped by single values or ranges. Visibility and symbols can be edited per group.
|
| |
Automatic Classification
 Thuban supports explorative data analysis with automatic classifications of data.
Supported are:
- unique values,
- uniform distribution and
- quantiles.
The number of groups is flexible, a ramp of symbols is generated for the resulting classification.
|
| |
Projections
 Thuban is distributed with a sample collection of projections and the set of coordinate systems as used by the EPSG (European Petroleum Survey Group).
For full flexibility projections can be assigned to the map and to each separate layer.
|
| |
Table Management
 The table view lists all records for a given layer. Data can be queried, the results are highlighted on the map. Additional data can be joined for detailed analysis and query results or entire tables can be exported.
|
| |
Localisation
 The Thuban User Interface is available for various languages:
 - English
- French
- German
- Italian
- Spanish and
- Russian (cyrillic script)
Further translations are welcome.
|
| |
Applications based on Thuban: GREAT-ER
 GREAT-ER is a simulation system that assesses the chemical exposure of, for example, household chemicals down-the-drain for real-existing geogaphically referenced river networks.
GREAT-ER is a nice example of how to add complex functionality to Thuban by modifiying or extending the menu, toolbar, and other elements.
|
| |


