5.2. Generating Classes
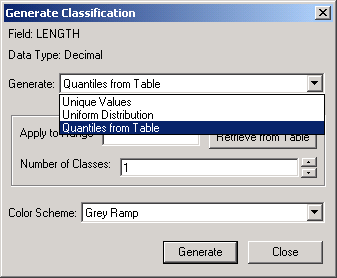
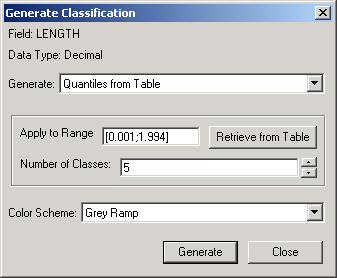
Creating a classification by hand can be tedious. Thuban, therefore, provides a means of generating an entire classification at once while still giving the user control over how it appears. Clicking opens the Generate Classification dialog. Under the Generate pull down there are at most three different ways to generate classifications: Unique Values, Uniform Distribution, and Quantiles. Some options may not be available if the data type for the field does not support them. For instance, Uniform Distribution doesn't make sense for a Text field.
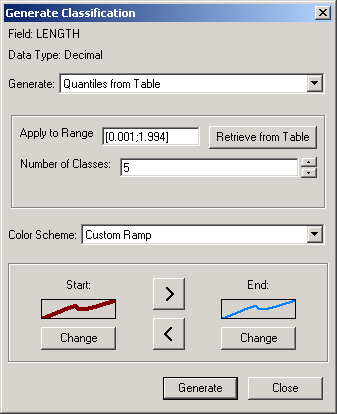
For every way of generating a classification, a color scheme must be selected. Thuban provides several different color schemes that affect how the group properties change over the classification. It may be desirable that only certain properties change over the classification. If the shape type is a polygon or a point then the option will be available. This allows the user to select a border color for all classification groups. It is also possible to create a custom color scheme. Selecting this option will display two symbols: the one of the left has the properties of the first group and the one on the right has the properties of the last group. Thuban will interpolate between these two properties to generate the other groups.
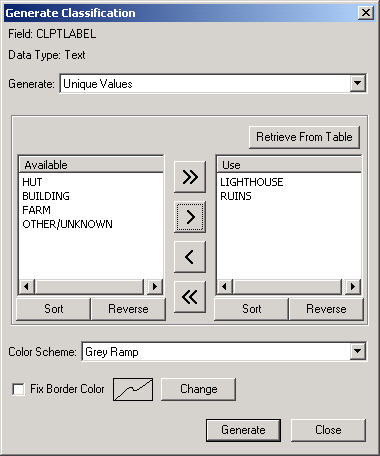
The Unique Values option lets the user select specific values that appear in the table. Clicking searches the table for all unique values and displays them in the list on the left. Items can be selected and moved to the list on the right. Each list can be sorted or reversed for easier searching. The classification that is generated will be in the same order as the list on the right.
The Uniform Distribution option creates a user specified number of groups of ranges such that each range covers equal intervals. The minimum and maximum values can automatically be retrieved from the table by clicking . The stepping is how large each interval is. Adjusting this value will automatically recalculate how many groups is appropriate.

The Quantiles option generates ranges based on the number of items in the table. For example, by specifying five groups Thuban will generate five groups with appropriate ranges such that 20% of the table data is in each group. If it is impossible to generate exact groupings, Thuban will issue a warning but allow the user to continue.